Hi there,
This is the best meme I've found during these days...
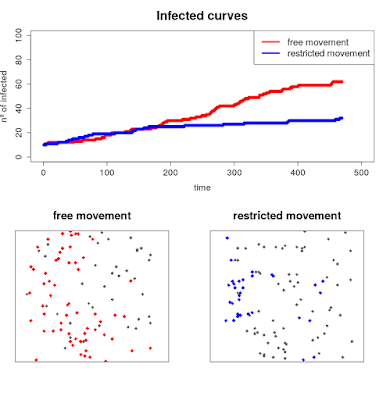
Well, here it is my "BUT" contribution. Some weeks ago The Washington Post published this
simulations about how "social distancing" could help to "flat the curve" of COVID-19 infections. I fell in love with these simulations because their simplicity and explanatory power. Indeed, you can use the pretty similar principles to simulate predator
hunt behavior and other movement patterns... I wrote some R code to have a tiny version of them...
 library(raster)
 library(dismo)

 r <- raster(nrows = 100, ncols = 100, xmn = 0, xmx = 100, ymn = 0, ymx = 100)
 r[] <- 0

 steps <- 500
 n <- 100

 locations <- data.frame(matrix(ncol = n, nrow = steps))

 pp <- randomPoints(r,n)
 cell <- cellFromXY(r, pp)
 infected <- 1:10
 pob <- 1:n
 ratio <- data.frame(1:steps, NA)
 pob_inf <- list()

 for (j in 1:steps){
  print(j)
  locations[j,] <- cell

  for(i in 1:n){

   cell[i] <- adjacent(r, cell[i], 8)[round(runif(1,0.51,nrow(adjacent(r, cell[i], 8))+0.49),0),2]

  }

  new_inf <- cell %in% cell[infected]
  infected <- pob[new_inf]
  ratio[j,2] <- length(infected)
  pob_inf[[j]] <- infected

 }

 locations2 <- data.frame(matrix(ncol = n, nrow = steps))

 cell2 <- cellFromXY(r, pp)
 infected2 <- 1:10
 pob2 <- 1:n
 ratio2 <- data.frame(1:steps, NA)
 pob_inf2 <- list()

 for (j in 1:steps){
  print(j)
  locations2[j,] <- cell2

  for(i in 1:25){

   cell2[i] <- adjacent(r, cell2[i], 8)[round(runif(1,0.51,nrow(adjacent(r, cell2[i], 8))+0.49),0),2]

  }

  new_inf2 <- cell2 %in% cell2[infected2]
  infected2 <- pob2[new_inf2]
  ratio2[j,2] <- length(infected2)
  pob_inf2[[j]] <- infected2

 }
Let's make some plots to
put them together in a GIF and better visualize the results...
 num <- seq(1,500,4)

 for (p in 1:125){
  id <- sprintf("%03d", num[p])
  png(paste("corona_",id,".png", sep=""), width=780, height=800, units="px", pointsize = 15)
  layout(matrix(c(1,1,2,3),2,2,byrow = TRUE))
  plot(ratio[1:num[p],],pch=19, xlim = c(0,500), ylim = c(0,100), ylab = "nº of infected",
     xlab = "time", col = "red", cex.axis = 1.4, cex.lab = 1.4, main = "Infected curves", cex.main = 2)
  points(ratio2[1:num[p],],pch=19,col="blue")
  legend("topright", legend = c("free movement", "restricted movement"),lwd = c(4,4), col = c("red","blue"), cex = 1.5 )
  plot(r, col = "white", legend = FALSE, axes = FALSE, main = "free movement", cex.main = 1.8)
  points(xyFromCell(r,as.numeric(locations[num[p],])), cex = 1.2, col = "grey40", pch = 18)
  points(xyFromCell(r,as.numeric(locations[num[p],]))[pob_inf[[num[p]]],], pch = 18, col = "red", cex = 1.4)
  plot(r, col = "white", legend = FALSE, axes = FALSE, main = "restricted movement", cex.main = 1.8)
  points(xyFromCell(r,as.numeric(locations2[num[p],])), cex = 1.2, col = "grey40", pch = 18)
  points(xyFromCell(r,as.numeric(locations2[num[p],]))[pob_inf2[[num[p]]],], pch = 18, col = "blue", cex = 1.4)

  dev.off()
 }
Done!
Stay safe!


